100% Free · No Signup · Your Data Stays With You
See Your Real Flipkart Profit — Not Just Sales
Upload your Flipkart reports and SellerLens shows your actual profit after returns, FK fees, settlements, ad spend, COGS and GST — in one clear dashboard.
- No Signup Required
- No API Access
- Your data stays in your browser
Works on Chrome, Edge & Brave · Setup in 5 minutes
SellerLens — Overview Tab
₹18.06 L
Bank Settlement
16.2×
Ad ROI
83.7%
SPF Approval Rate
Built for serious Flipkart sellers
Is Your Flipkart Dashboard Hiding the Real Truth?
FK shows you sales. SellerLens shows you survival.
Unclear Profits
FK's dashboard shows gross revenue — not profit after returns, RTO, commissions, COGS and ads. You may be running at a loss and not know it.
Returns Killing Margins
66% return rate on some SKUs can destroy profit entirely. Without per-SKU return + damage tracking, you're flying blind.
Settlement Surprises
Delivered orders that aren't in settlement, clawbacks you didn't expect, overdue payments — FK doesn't surface these clearly.
Every Number You Need. One Dashboard.
Real screenshots from an actual SellerLens account — not mockups.
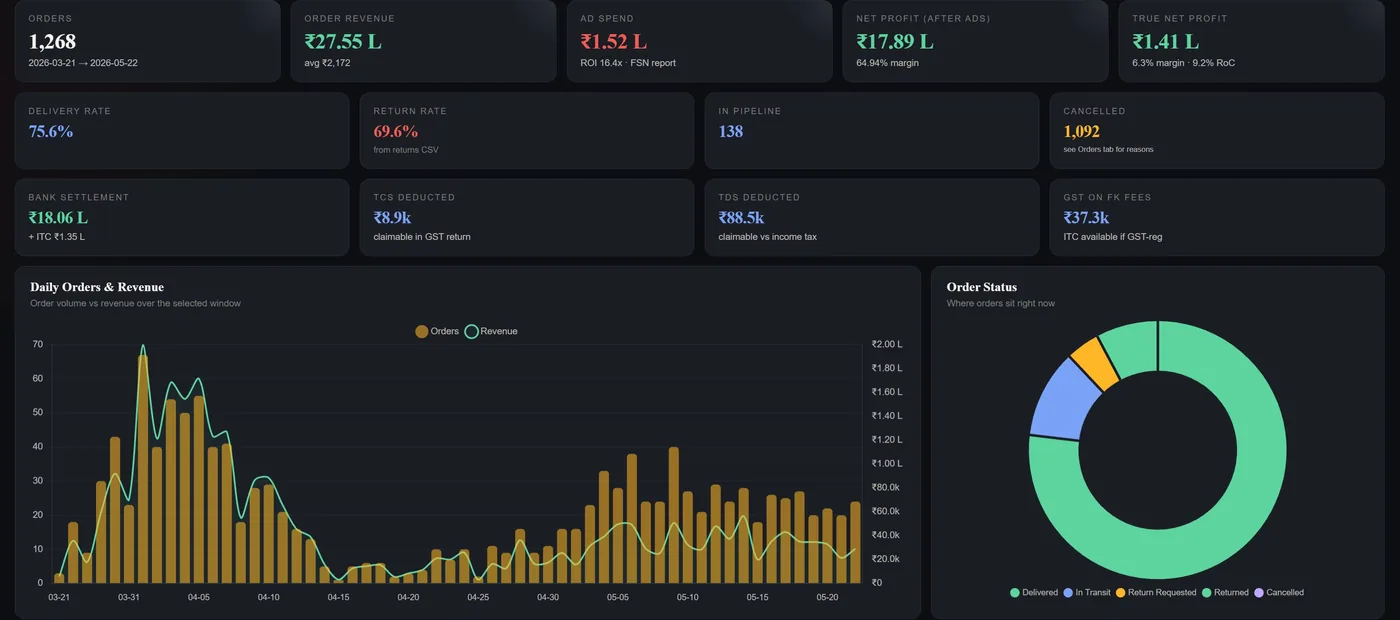
₹27.55 LOrder Revenue
₹1.41 LTrue Net Profit
₹18.06 LBank Settlement
75.6%Delivery Rate
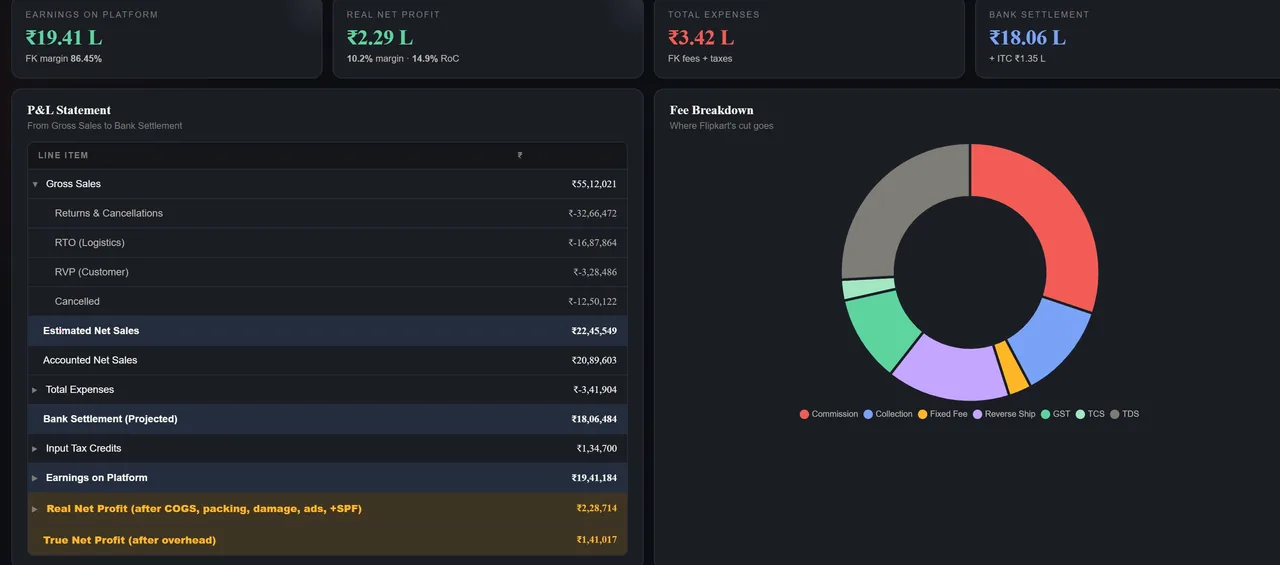
₹55.12 LGross Sales
₹19.41 LFK Earnings
₹2.29 LReal Net Profit
10.2%Net Margin
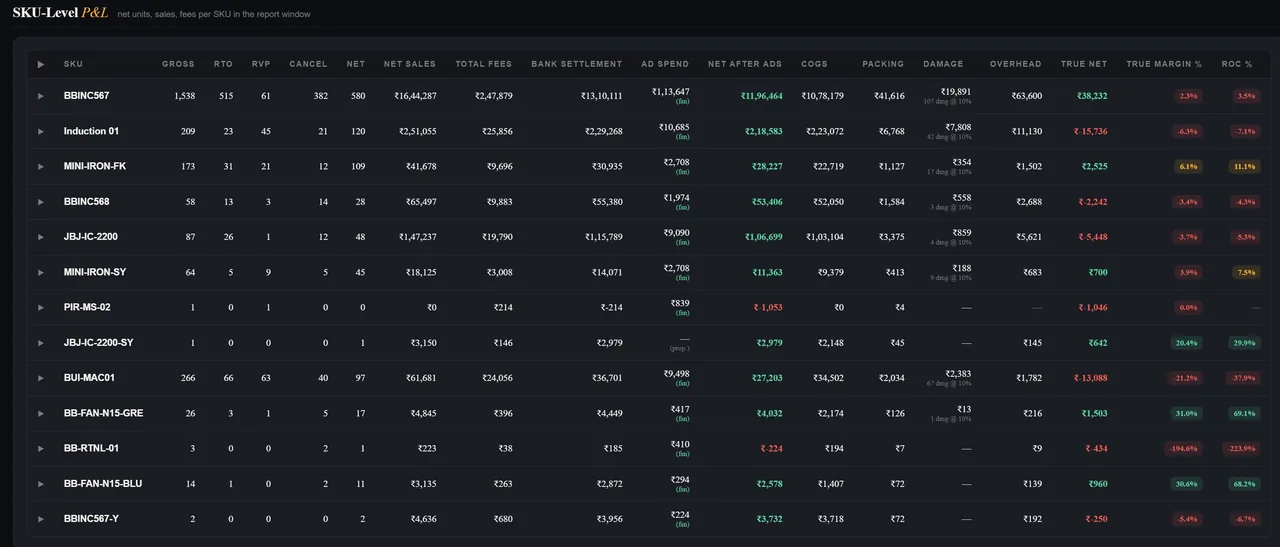
13 SKUsTracked
True NetPer SKU
DamageFactored In
ROC %Return on Cost
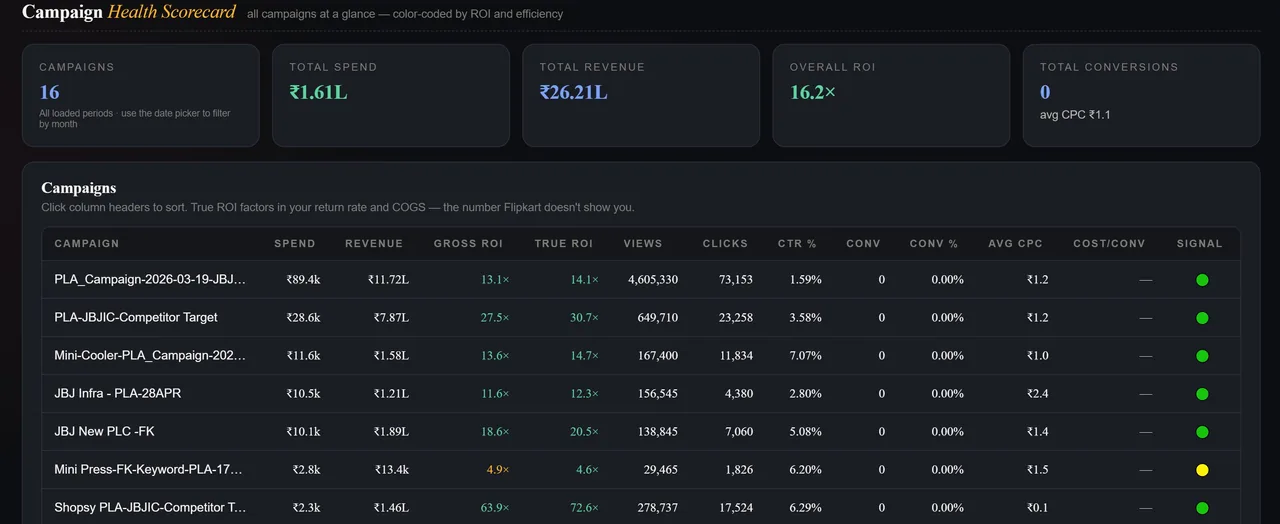
16.2×Overall Ad ROI
₹1.61 LTotal Ad Spend
True ROIAfter Returns
Waste FinderZero-conv terms
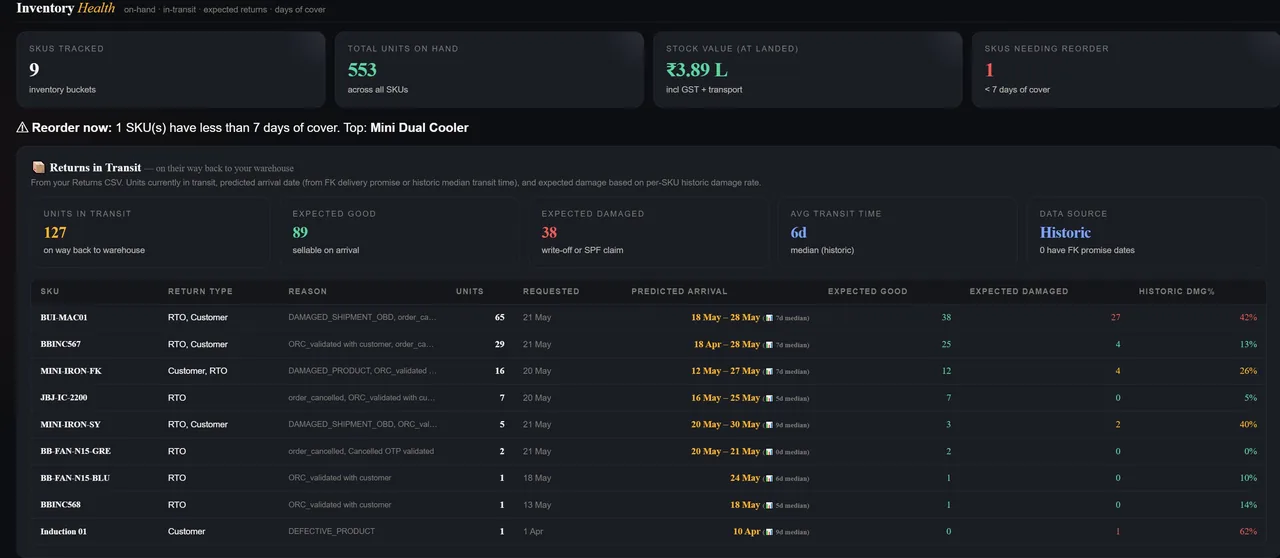
127Units in Transit
89Expected Good
38Expected Damaged
6 daysAvg Transit Time
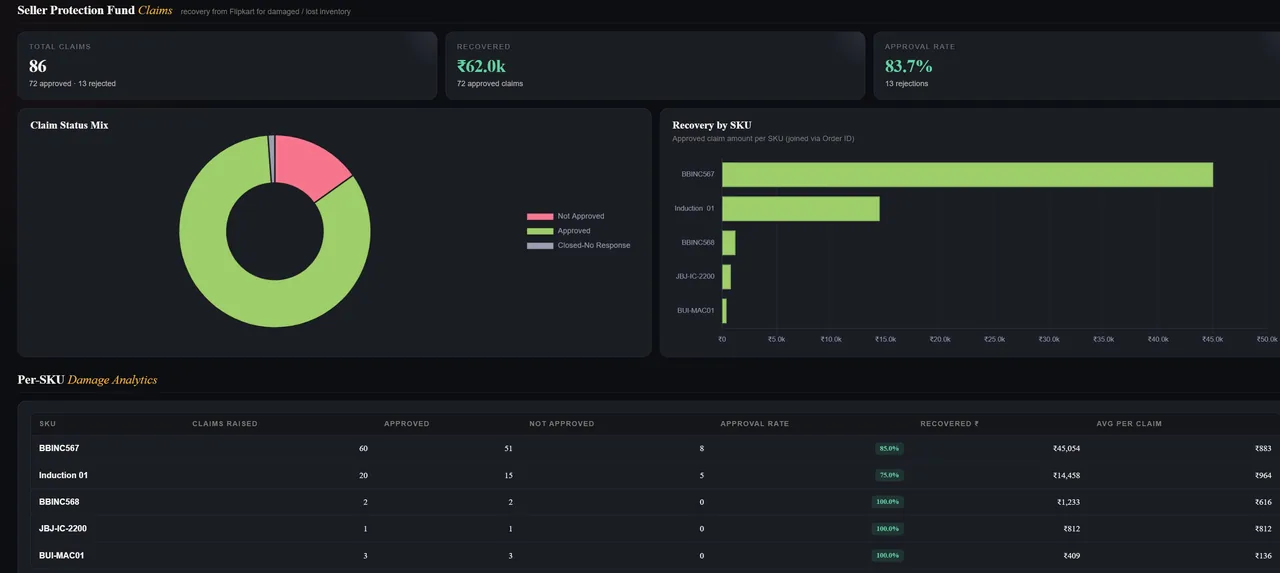
₹62.0kRecovered
83.7%Approval Rate
86Total Claims
Per-SKUDamage Analytics
Open Your Free Dashboard →
Upload your FK reports · See your real numbers in minutes
From Reports to Real Insights in Minutes
No installation. No API. No account.
Upload Your FK Reports
Orders, P&L, Returns, Settlements, FSN Ad Reports, SPF Claims, Purchase Ledger. Drag and drop — all stays in your browser.
Add Your True Costs
Fill our simple cost template with purchase price, GST rate, transport and packaging per SKU. Takes 10 minutes once.
See Your Real Numbers
True profit per SKU, settlement gaps, return damage, ad ROI, inventory cover days, SPF claims — all calculated automatically.
Everything You Need to Run a Profitable Flipkart Business
15+ analytics tabs. One dashboard. Zero guesswork.
SKU-Level True P&L
Gross → returns → RTO → FK fees → COGS → damage → overhead → true net per SKU. The number FK never shows you.
Return Loss Analysis
Per-SKU return rate, damage classification, transit prediction and SPF recovery opportunity — all from your Returns CSV.
Settlement Reconciliation
Delivered orders not in settlement, overdue payments, clawback warnings and amount mismatches — automatically flagged.
Ads Intelligence
True ROI after returns and COGS, waste finder for zero-conversion terms, budget pacing and SKU-level ad profitability.
Inventory Planning
Returns in transit + predicted arrival + expected damage. Days of cover. Reorder alerts. Damaged stock write-off tracking.
SPF Claim Tracker
Track approved, rejected and unclaimed SPF amounts. See which SKUs have unrecovered damage you can still file for.
Pricing Intelligence
Know exactly what selling price is needed to hit your target margin, factoring in all FK fees, COGS and return rate.
Waste Finder
Search terms burning money with zero conversions, dead placements, low-ROI keywords — copy and block in one click.
15+ Analytics Tabs
Overview · Orders · P&L · Ads Intelligence · Settlement · Listings · SKU Health · Pricing · Strategy · Inventory · Purchases · SPF Claims · Returns · and more. Everything in one place for your entire Flipkart business.
See the Dashboard →Real Numbers From a Real Seller Account
These aren't sample data. These are actual SellerLens outputs from a live Flipkart seller.
Gross Sales (3-month period)
₹55.12 L
1,268 orders across multiple SKUs
True Net Profit
₹2.29 L
10.2% margin · after COGS, ads, damage
Returns in Transit Right Now
127 units
89 good · 38 expected damaged
SPF Recovery (from damages)
₹62,000
83.7% claim approval rate
Ad Campaign ROI
16.2×
₹1.61L spend → ₹26.21L revenue
Bank Settlement (Projected)
₹18.06 L
+ ITC ₹1.35L recoverable
SellerLens computed all of this automatically from standard FK reports — Orders CSV, P&L XLSX, Returns CSV, SPF XLSX and FSN Ad Report.
🔒
Your Data Stays 100% With You
SellerLens works entirely in your browser. We never see your reports, orders or financial data.
- No signup or login required
- No data sent to our servers
- No Flipkart API access
- Upload reports locally
- Export or clear anytime
- Works offline after loading
All The Flipkart Reports You Need.
One Time Setup.
Download from FK Seller Hub. Upload once. SellerLens auto-detects everything.
Orders Report
CSV
P&L Report
XLSX
Returns Report
CSV / XLSX
Settlement Report
via P&L XLSX
FSN Ad Report
CSV
Listings File
XLSX
SPF Claims
XLSX
Cost Template
We provide it free
Setup takes less than 5 minutes. Update reports whenever you want fresh numbers.
SellerLens Is Perfect For
Growing Sellers
Who want to scale with profitable SKUs, not just more sales.
Multi-SKU Sellers
Who don't know which products are actually making money.
Brands & Manufacturers
Who need accurate profit reporting beyond FK's dashboard.
Ad-Spending Sellers
Who want true ROI, not just FK's ACOS or Gross ROI.
Private Label Sellers
Who need margin-level control and data-driven decisions.
Flipkart Seller Profit — Your Questions Answered
The numbers Flipkart's own dashboard never explains.
How do I calculate my real profit on Flipkart?
Your real profit is what's left after returns, RTO, Flipkart commission and shipping fees, GST, product cost, packaging, ad spend and damage are subtracted from your sales. SellerLens computes this automatically for every SKU from your standard Flipkart reports — free and in your browser — so you see true net profit, not just gross sales.
How much commission does Flipkart charge sellers?
Flipkart's commission varies by product category, on top of collection fees, fixed fees and shipping or RTO charges — so two SKUs at the same price can net very different amounts. SellerLens reads the exact fees from your Flipkart P&L report and shows your real per-SKU fee load, with no guesswork.
Why are my Flipkart returns so high, and how do they hurt profit?
Returns hurt twice — you lose the sale and often pay reverse shipping plus damage on items that come back unsellable. A high return rate on even a few SKUs can erase your margin. SellerLens shows per-SKU return rates, damage and the exact rupee impact, so you can see which products are bleeding profit.
What is RTO on Flipkart?
RTO (Return to Origin) is when an order ships but is never delivered and comes back to you — you still absorb forward and reverse logistics costs with no sale to show for it. RTO quietly eats margins. SellerLens separates RTO from normal returns so you can see its true cost across your orders.
What is a Flipkart SPF (Seller Protection Fund) claim?
SPF reimburses sellers for items damaged or lost inside Flipkart's logistics. Many sellers leave money unclaimed because they don't track eligible damages. SellerLens reads your returns and SPF reports, shows your claim approval rate, and flags damaged returns you haven't claimed yet — recoverable money you can still file for.
Is SellerLens free, and is my data safe?
Yes — SellerLens is completely free with no signup. It runs 100% in your browser: your Flipkart reports are processed on your own device and are never uploaded to any server. You can export or clear your data anytime. Nothing about your business leaves your computer.
Which Flipkart reports do I need to upload?
Start with your Orders CSV and P&L (XLSX) from Flipkart Seller Hub. For deeper insight add Returns, Settlement, FSN Ad reports and SPF claims, plus a simple cost template we provide free. SellerLens auto-detects each file and tells you what's loaded and what's still needed.
How do I find which Flipkart SKUs are losing money?
Gross sales hide loss-making products. SellerLens calculates true net profit for every SKU after all fees, returns, product cost and ads — then flags the ones running at a loss. You see exactly which products to reprice, fix or drop, instead of guessing from Flipkart's sales dashboard.
Can I improve my Flipkart profit and ad ROI?
Often yes — once you can see where the leaks are (ad waste, thin-margin SKUs, high returns), they're usually fixable. SellerLens surfaces these opportunities for free. If you'd like help acting on them, Tripping Vibe Digital — the team behind SellerLens — manages Flipkart ads and listings for growing sellers.
What is true net profit for a Flipkart seller?
True net profit is what a Flipkart seller actually keeps after every deduction is removed from gross sales — Flipkart commission and fees, returns and RTO, COGS, GST/TCS/TDS, ad spend, packing and damaged-return losses. It is not ROAS or gross revenue; it is the per-SKU number that shows whether each product makes money.
Why doesn't my Flipkart settlement match my sales?
Settlement is often lower than sales because fees, commissions, TCS/TDS, returns, RTO and ad recoveries are deducted before payout, and genuine mismatches occur. SellerLens reconciles your settlement report against your orders to flag underpayments and mismatches.
Why am I losing money on Flipkart despite high sales?
High sales with low profit usually means margin leaks through returns and RTO, zero-conversion ad spend, loss-making SKUs, Flipkart fees, GST/TCS/TDS and damaged returns. SellerLens breaks profit down per SKU and per keyword from your own reports to show exactly where money is leaking and how much is recoverable.
Flipkart Seller Guides
Free, in-depth guides on the numbers that actually decide your Flipkart profit.
Why am I losing money on Flipkart despite high sales?
The 6 hidden leaks — returns & RTO, ad waste, loss-making SKUs, fees, tax and damaged returns — and how to find yours.
Read the guide →
What is true net profit for a Flipkart seller?
The formula, true net profit vs ROAS vs gross sales, and why profit must be measured per SKU.
Read the guide →
Why doesn't my Flipkart settlement match my sales?
The deductions taken before payout, the genuine mismatches that happen, and how to reconcile against your orders.
Read the guide →
How to claim Flipkart SPF for damaged returns
What the Seller Protection Fund covers, why sellers leave money unclaimed, and how to recover it.
Read the guide →
Your Flipkart Reports Already Have The Answers. SellerLens Makes Them Readable.
- No Signup
- No API Access
- No Data on Servers
- Works in Browser